
StyleGAN mapping sampling points visualization by embedding projector
Some days after the former post of StyleGAN Mapping Network Geometry Visualization, I realized that there are some canonical dimension reduction methods for data visualization, such as PCA, t-SNE. These ways may be more intuitive to show data characteristics. So I did some attempts on this.
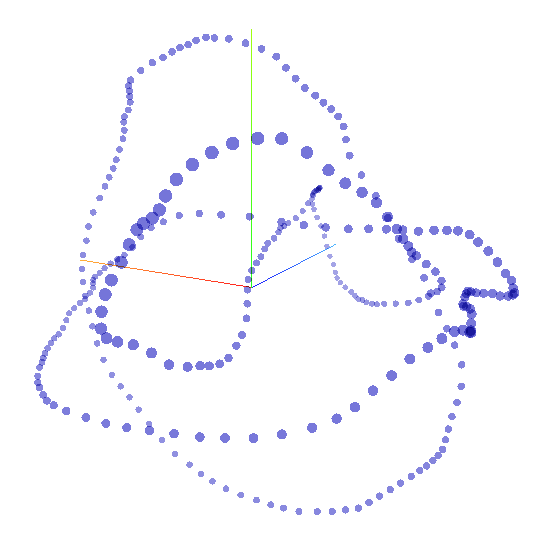
Firstly I tried a t-SNE implementation by tensorflow.js, disappointedly, after a moment struggling against release version compatibility problem, I found that the upper limit of data dimensions is merely 40 on a browser WebGL backend, while SytleGAN W space is 512-d.
Finally, I give up the attempt of a more sophisticated t-SNE implementation, I found the tensorflow embedding projector is a not bad option. Its integration with github gist is handy.
This is the live 3D visualization. It seems t-SNE result is more smooth, but a bit unstable. For t-SNE, the result to the experiment of one random circle, points will convergence to a nearly regular round. That seems mainly caused by lack of adjacencies on a circle sampling. Then I made a configuration of 3 random circles, as shown in the top illustration. Most dimension reduction algorithm normalized original data, therefore the bias information is lost. That is a disadvantage.